


-
1
-
2
-
3
-
4
-
5
-
6
-
7
-
8
-
9
-
10
-
11
-
12
-
13
-
14
-
15
-
16
-
17
-
18
-
19
-
20
-
21
-
22
-
23
-
24
-
25
-
26
-
27
-
28
-
29
-
30
해당 자료는 10페이지 까지만 미리보기를 제공합니다.
10페이지 이후부터 다운로드 후 확인할 수 있습니다.
10페이지 이후부터 다운로드 후 확인할 수 있습니다.


목차
Ⅰ. Objective & Keyword
Ⅱ. Introduction & Background
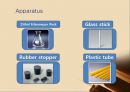
Ⅲ. Apparatus
Ⅳ. Reagents
Ⅴ. Experimental process
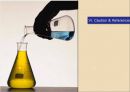
VI. Caution & References
Ⅱ. Introduction & Background
Ⅲ. Apparatus
Ⅳ. Reagents
Ⅴ. Experimental process
VI. Caution & References
본문내용
Experimental process
Place the strips on a clean, dry sheet of paper and make a pencil mark about ¾” from one end of each strip. At the top of each strip, label the indicator that you will place on that strip.
(2) Dip the applicator into an indicator solution and put
a ¼” spot on the pencil line on the strip. Repeat this
procedure for each of the other indicators. Allow the
strips to dry.
(3) Pour about 50mL of the eluting solvent into two
250mL Erlenmeyer flasks. Close the flask by a stopper
immediately.
(4) When the sample spots are dry, hang the strips in a
flask, so that the ends of the strips, but not the
sample spots, are in the solvent.
(5) Let the solvent rise on the strip until the solvent front
has moved above the band from the indicator. At
that time, remove the strip from the flask. Draw a
pencil line along the solvent front of the strip, and
allow the strips to dry for several minutes.
(6) When the strips have dried, hold each strip for 2~3
minutes over the open mouth of 2~3 drops of
concentrated ammonia, and record the color of the
band associated with each indicator in this basic
environment.
(7) Pour about 10mL dimethylglyoxime into the Petri dish,
and immerse the strip in it. After it is completely wet,
take out and dry the strip. Draw a pencil line of
appeared spots. Repeat the 7th step for ammonium
thiocyanate solvent.
(8) When you know the position of the band to be
associated with each indicator, measure the distance
from the point at which the indicator was applied to
the center of the top of the band.
(9) For each indicator, also measure the distance
(10) Calculate Rf values for each indicator.
추천자료
 박층 크로마토 그래피 (Thin Layer Chromatography)실험
- 소결조제에 의한 Alumina coloring 실험 보고서
- 반도체 집적회로 공정
- [공학]젖음성실험(Wettability Test) 보고서
- [공학실험]열전도 실험 예비, 결과 레포트
- 석유화학공업에서의 폴리에틸렌과 폴리프로필렌이 가지는 의미와 제조 현황 그리고 그 미래
- [원자력][원자력발전]원자력(원자력발전)의 탄생과 원자력(원자력발전)의 기본원리, 기초이론...
- 세포 공학 실험 전기영동(electrophoresis)
- (최종)물리센서실험
- (최종)자동제어부품실험
- 관로마찰 실험 결과레포트(최종)
 [Display 공학] TFT-LCD실험, AMOLED의 유기재료로 박막증착하여 특성비교 (PEDOT:PSS, PDY-132)
- [신소재공학실험] 소결온도에 따른 주석(Sn)의 특성변화 측정
- 가격12,600원
- 페이지수30페이지
- 등록일2014.04.06
- 저작시기2014.1
- 파일형식기타(pptx)
- 자료번호#911789

본 자료는 최근 2주간 다운받은 회원이 없습니다.


소개글